Volatility and Returns: Why Long-Term Investors should Care
When evaluating investments, most people focus on returns – how much something gained or lost in a given year. But what often goes unnoticed is the volatility of those returns, and how it quietly eats into your long-term performance.
As a long-term investor, you should absolutely care about volatility, because it creates something called volatility drag – the mathematical reality that volatile returns compound less effectively over time. In other words, the more an asset bounces around, the less you’ll end up with in the long run, even if the average return seems attractive on paper.
Arithmetic vs. Geometric Returns
The arithmetic return is the simple average of annual returns. It doesn’t consider the impact of volatility or compounding. The geometric return, also known as the compound annual growth rate (CAGR), does account for both.
Let’s look at an example to illustrate why this difference matters:
|
Asset |
Year 0 |
Year 1 |
Year 2 |
Final Value |
Avg. Annual Return |
CAGR |
|
A |
100 |
110 |
121 |
121 |
+10% |
10% |
|
B |
100 |
60 |
96 |
96 |
+10% |
-2% |
Both Asset A and B appear to have the same average return, but only Asset A grew in value. Asset B’s volatility ruined its compounding, even though the arithmetic average was the same. This is the essence of volatility drag.
The Asymmetry of Losses and Gains
A critical factor behind volatility drag is that losses hurt more than equivalent gains help:
- Lose 50%? You need a 100% gain to break even.
- Lose 30%? You’ll need a 43% gain to recover.
So even if you’re right half the time, big losses can destroy your wealth if volatility is too high.
Visualizing Volatility Drag
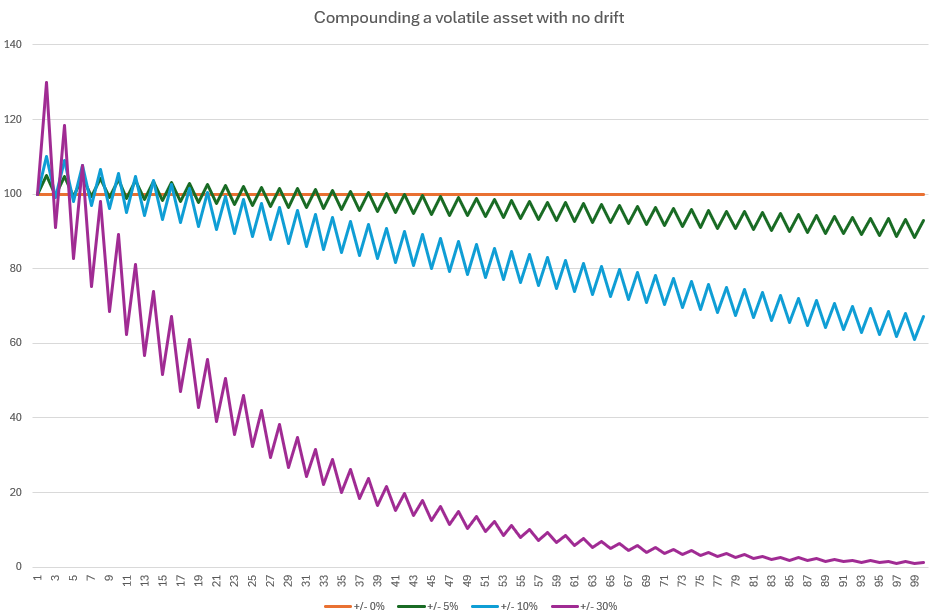
Let’s imagine four assets that all start at $100 and have no expected return (zero drift), but differ in daily volatility:
|
Volatility |
Day 1 Return |
Day 2 Return |
Long-Term Effect |
|
0% |
0% |
0% |
$100 remains $100 |
|
±5% |
+5% |
-5% |
Down to $99.75 |
|
±10% |
+10% |
-10% |
Down to $99 |
|
±30% |
+30% |
-30% |
Down to $91 |
Even though the average return is 0%, your portfolio shrinks purely due to volatility. This is a textbook example of compounding working against you.
The effect becomes more obvious, the longer you extend the timeline. The following graph shows the volatility drag from the example above for a period of 100 days:

Adding a Positive Drift (Expected Return)
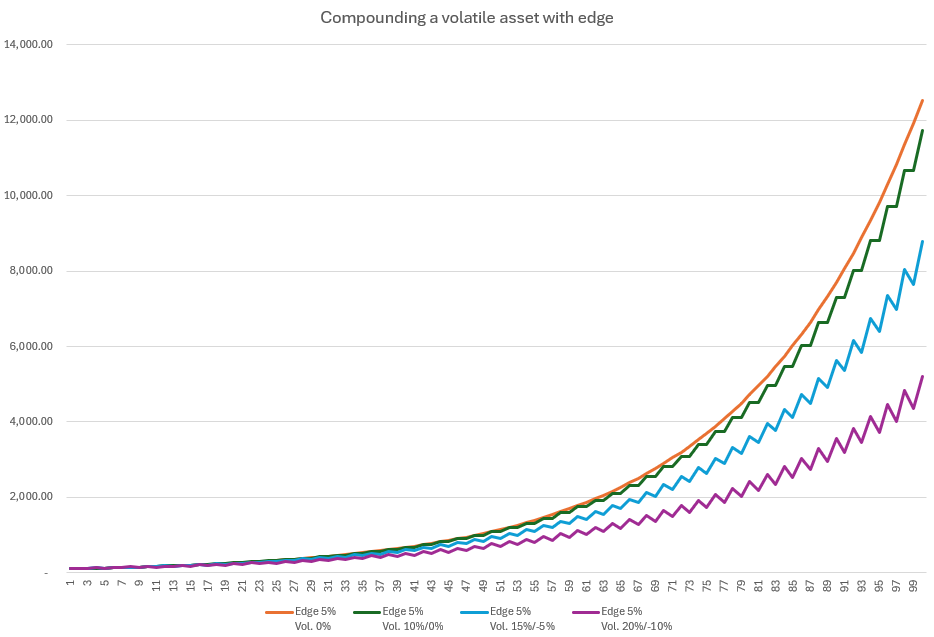
Now assume each of the above assets has a 5% expected return but still experiences different levels of volatility. Here’s what happens to their Compound Annual Growth Rate (CAGR) over time:
|
Scenario |
Edge (Drift) |
Volatility |
CAGR |
|
1 |
5% |
0% |
5.0% |
|
2 |
5% |
10% / 0% |
4.9% |
|
3 |
5% |
15% / -5% |
4.6% |
|
4 |
5% |
20% / -10% |
4.0% |
The takeaway: the higher the volatility, the more your CAGR gets dragged down, even if your average return stays the same.
The effect becomes again more obvious over a period of 100 days:

Why This Matters for Portfolio Construction
- Diversification is your friend. Combining uncorrelated assets smooths returns and reduces overall portfolio volatility, helping you retain more of your gains.
- Risk-adjusted returns > raw returns. Two portfolios might have the same average return, but the one with lower volatility will typically grow your wealth more effectively over time.
- Compounding is not linear. Volatility interferes with it – and the more volatility you allow into your portfolio, the more return you need just to break even.
Conclusion: Smooth and Steady Wins the Race
Volatility isn’t just about how bumpy the ride is – it’s about how much fuel gets lost along the way. As a long-term investor, understanding and managing volatility can mean the difference between growing your wealth consistently or spinning your wheels.
Focus on geometric returns, build a well-diversified portfolio, and don’t get seduced by high-flying assets unless you’re prepared to weather the volatility drag they bring.
In investing, how much you make matters, but how smoothly you make it matters just as much.

